- Are you ok?
- Nah, man, I’m pretty far from OK.
That’s one of the dialogues from Tarantino’s Pulp Fiction, but it seems to me that this is how corporate executives (*cough* earnings season cough) would ask the economy how it’s doing in light of the current situation with tariffs – and that’s what the world economy would have replied.
Trump’s smoke and mirrors rhetoric still impacts market sentiment, but sooner or later, market will get back to focusing on what’s really going on and who will pay for what. And the impact of tariffs ain’t gonna be pretty.
Quoting Yahoo!Finance:
“China rejected US trade overtures Thursday, demanding all tariffs be lifted and denying any progress in talks. “The US should... thoroughly remove all unilateral tariffs... if it really wants to solve the problem,” said Commerce Ministry spokesman He Yadong, calling reports of ongoing negotiations “groundless.””
We had a corrective rally in the markets (stocks, copper) based on the fact that they had previously fallen too far too fast (and we made some quick gains on that, remember?), and yesterday we likely saw the opposite.
Namely, the markets were just too happy to hear Trump’s “we’ll be very nice to China” and seem to have rallied too much given that nothing materially changed. The tariffs for China are still extremely high (and vice-versa), and the tariffs for the rest of the world are still being implemented – they are just delayed.
This is detrimental to world trade, global growth, and, in consequence, to demand for commodities and companies’ sales and profitability.
And yet, markets are emotional in the short run (which is great, because this allows us to enter positions at superb risk/reward ratios), so that’s what we see on the charts:
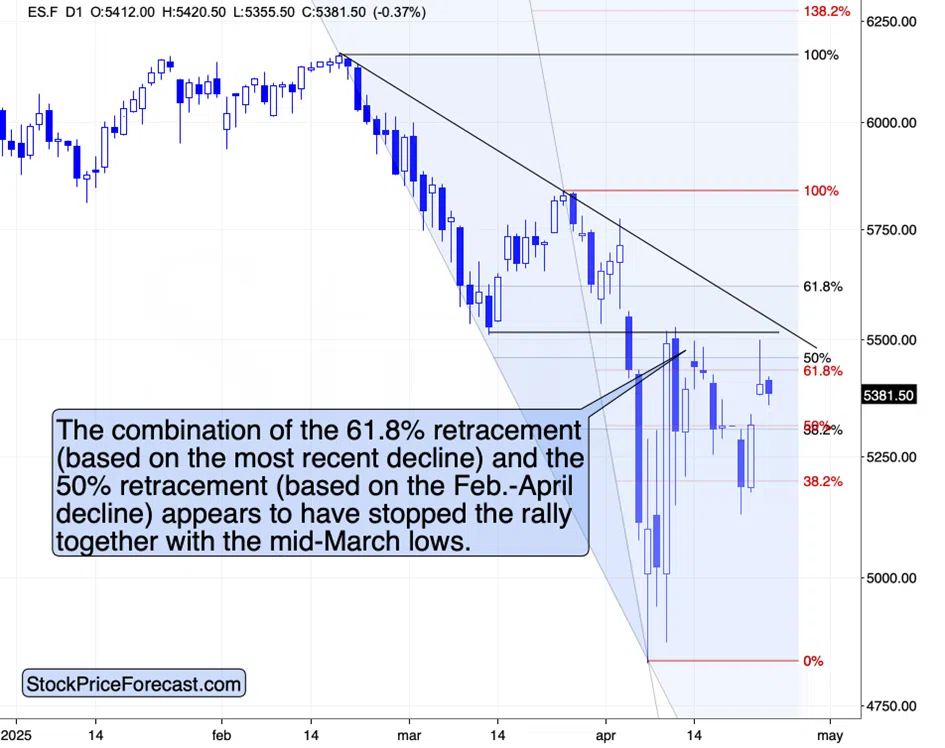
Back-and-forth movement below the previous lows shows that while the investors got excited, nothing changed regarding the outlook. The key short-term resistance levels (the March low, the declining resistance line, and the Fibonacci retracements) remain unbroken.
Plus, yesterday’s shooting star reversal candlestick suggests that the final part of the corrective rally might be over here.
Now, the short-term stock market might be the timeliest chart to look at, but it’s not the most important one. The one that I’m about the feature is.
It’s the long-term USD Index chart that you already saw previously, but the annotations are new. Be sure to click on the chart to expand it and see the details.

I previously mentioned multiple long-term analogies to the current situation, and the above chart shows you just how similar the situation is in all three of them: in 2008, 2011, and 2018:
- The 2008 is the key analogy due to the likely massive impact that the tariff hikes are going to have on the world economy. Back then, we had the sub-prime crisis, and now have the tariff crisis, even though it’s not widely called as such (yet). Multiple markets show analogies between the recent tops and the 2008 tops. In fact, the only market that is not in great alignment (“only” in a quite good one) is silver, which back then formed a top well above the previous highs, and this time it didn’t.
- The 2011 top provides very clear analogy in gold, silver, and mining stocks, as well as in copper. It also provides a quite clear analogy in the USD Index – the bottom was broader previously, but let’s keep in mind that the history rhymes instead of being repeated to the letter. The situation is not aligned that much.
- The 2018 is also a strong analogy due to the political comments that triggered USD’s final sell-off. The technical signs for the USDX (its RSI) are also aligned. The situation in copper, and precious metals (+miners) is also similar. It’s not as similar in case of the stock market.
In each of those cases, the similarities are remarkable, and, in each case, they point to the same outcome: a big rally in the USD Index along with a big decline in the precious metals sector as well as copper. And yes, FCX also plunged in all three cases (just like it did recently, when after which we cashed in huge profits).
Summing up, the emotion/optimism-based corrective upswing appears to be nearing its end (or its already over) while the USD Index appears to have formed a MAJOR bottom. This creates a great trading opportunity for those willing to trade against the investment public.
Thank you for reading the above free analysis. If you'd like to access my complete premium analysis, including specific technical targets for FCX (even options) and silver, detailed analysis of mining stocks, and comprehensive portfolio insights, consider subscribing to my Gold Trading Alerts. If you’re not ready to subscribe yet, I invite you to stay updated with our free analyses - sign up for our free gold newsletter now.
Thank you.
Przemyslaw K. Radomski, CFA
Founder, Editor-in-chief